← HomeFunding calls →Academic positions →
METHODOLOGY LIBRARY

Clinical research methodology, made practical

Every methodology carousel we have published: swipe through the slides here, no Instagram account needed. Key points and references under each one. New topics every day.

Randomization & blinding

Response-Adaptive Randomization: Promise and Pitfalls – slide 1 of 5Response-Adaptive Randomization: Promise and Pitfalls – slide 2 of 5Response-Adaptive Randomization: Promise and Pitfalls – slide 3 of 5Response-Adaptive Randomization: Promise and Pitfalls – slide 4 of 5Response-Adaptive Randomization: Promise and Pitfalls – slide 5 of 5
23 Oct 2026

Response-Adaptive Randomization: Promise and Pitfalls

Response-adaptive designs allocate more patients to winning treatments but fail if outcome feedback is slow.

Key points and references

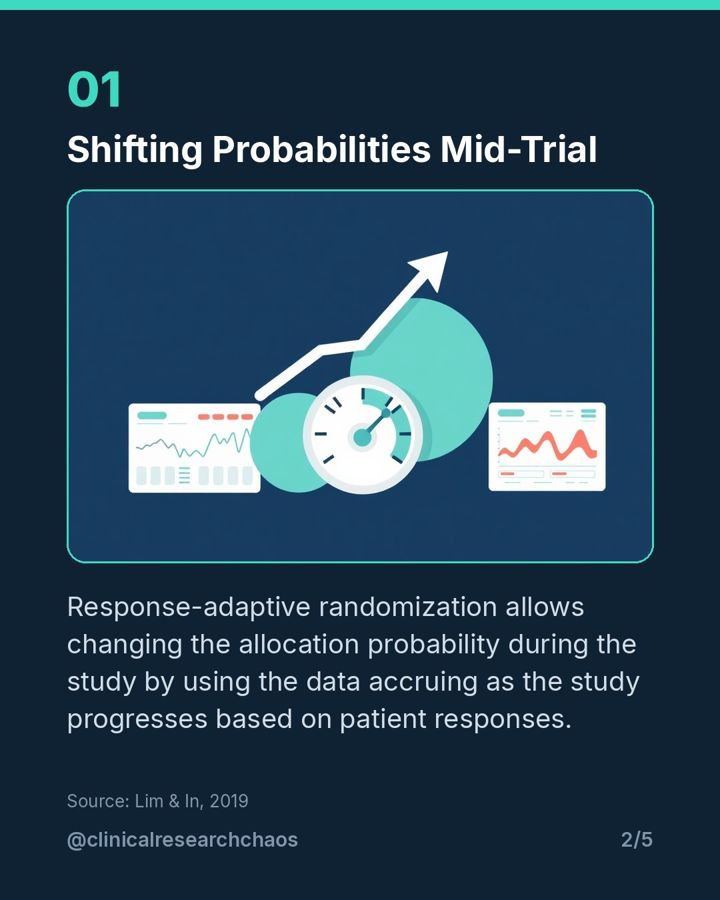
Shifting Probabilities Mid-Trial

Response-adaptive randomization allows changing the allocation probability during the study by using the data accruing as the study progresses based on patient responses.

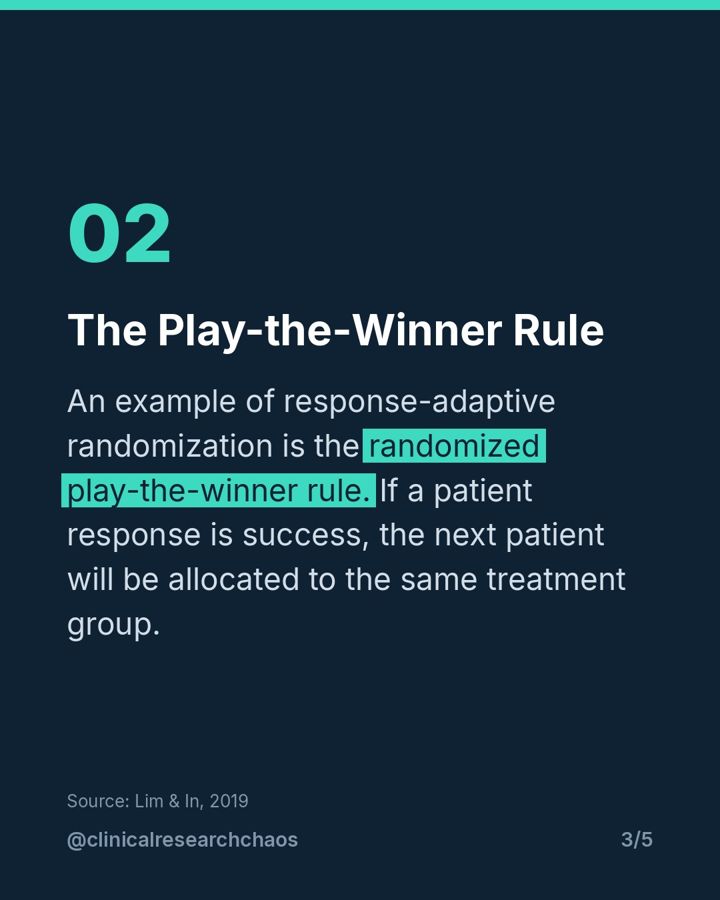
The Play-the-Winner Rule

An example of response-adaptive randomization is the randomized play-the-winner rule. If a patient response is success, the next patient will be allocated to the same treatment group.

Ethical Appeal vs Practical Limits

This method is based on the ethics of allowing more patients to be allocated to treatments that benefit the patients. However, if clinical studies take a very long time to obtain results, this method cannot be recommended.

References

Lim, C.-Y., & In, J. (2019). Randomization in clinical studies. Korean Journal of Anesthesiology, 72(3), 221-232.
Block Randomization: Fixing Group Imbalances – slide 1 of 5Block Randomization: Fixing Group Imbalances – slide 2 of 5Block Randomization: Fixing Group Imbalances – slide 3 of 5Block Randomization: Fixing Group Imbalances – slide 4 of 5Block Randomization: Fixing Group Imbalances – slide 5 of 5
21 Oct 2026

Block Randomization: Fixing Group Imbalances

Use block sizes of 4 or more to maintain equal group sizes without triggering severe selection bias.

Key points and references

Why Use Block Randomization

To avoid sample size imbalances in small trials, we set blocks for randomization and balance the number of subjects in each block.

The Danger of Small Block Sizes

If the block size is 2, the allocation result of the second subject in the block can be easily predicted with a high risk of observation bias.

Protecting Against Selection Bias

Therefore, the block size used should preferably be 4 or more. To reduce the risk of predictability from the use of one block size, the size may be varied.

References

Lim, C.-Y., & In, J. (2019). Randomization in clinical studies. Korean Journal of Anesthesiology, 72(3), 221-232.
Stratified Randomization and the Sparse Strata Trap – slide 1 of 5Stratified Randomization and the Sparse Strata Trap – slide 2 of 5Stratified Randomization and the Sparse Strata Trap – slide 3 of 5Stratified Randomization and the Sparse Strata Trap – slide 4 of 5Stratified Randomization and the Sparse Strata Trap – slide 5 of 5
21 Oct 2026

Stratified Randomization and the Sparse Strata Trap

Too many strata in a trial will leave your subgroups empty and ruin your randomization balance.

Key points and references

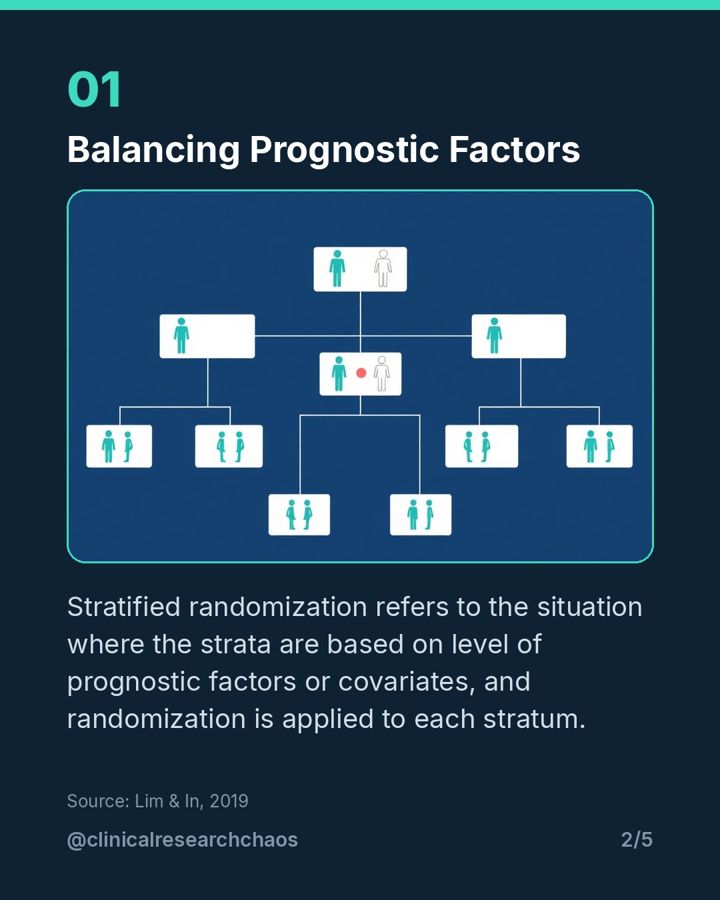
Balancing Prognostic Factors

Stratified randomization refers to the situation where the strata are based on level of prognostic factors or covariates, and randomization is applied to each stratum.

The Risk of Too Many Strata

If several important prognostic factors affect the outcome, the number of strata would increase. In case of several strata in relation to the target sample size, strata may be empty or sparse.

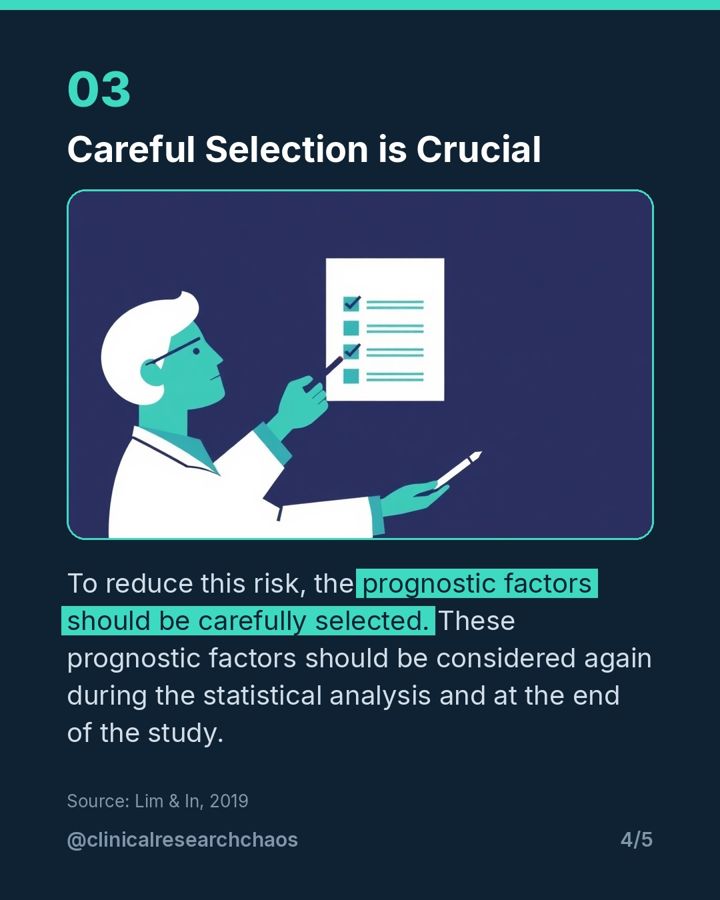
Careful Selection is Crucial

To reduce this risk, the prognostic factors should be carefully selected. These prognostic factors should be considered again during the statistical analysis and at the end of the study.

References

Lim, C.-Y., & In, J. (2019). Randomization in clinical studies. Korean Journal of Anesthesiology, 72(3), 221-232.
Minimization: Balancing Covariates Dynamically – slide 1 of 5Minimization: Balancing Covariates Dynamically – slide 2 of 5Minimization: Balancing Covariates Dynamically – slide 3 of 5Minimization: Balancing Covariates Dynamically – slide 4 of 5Minimization: Balancing Covariates Dynamically – slide 5 of 5
21 Oct 2026

Minimization: Balancing Covariates Dynamically

Minimization dynamically balances covariates across study arms but sacrifices strict mathematical randomness.

Key points and references

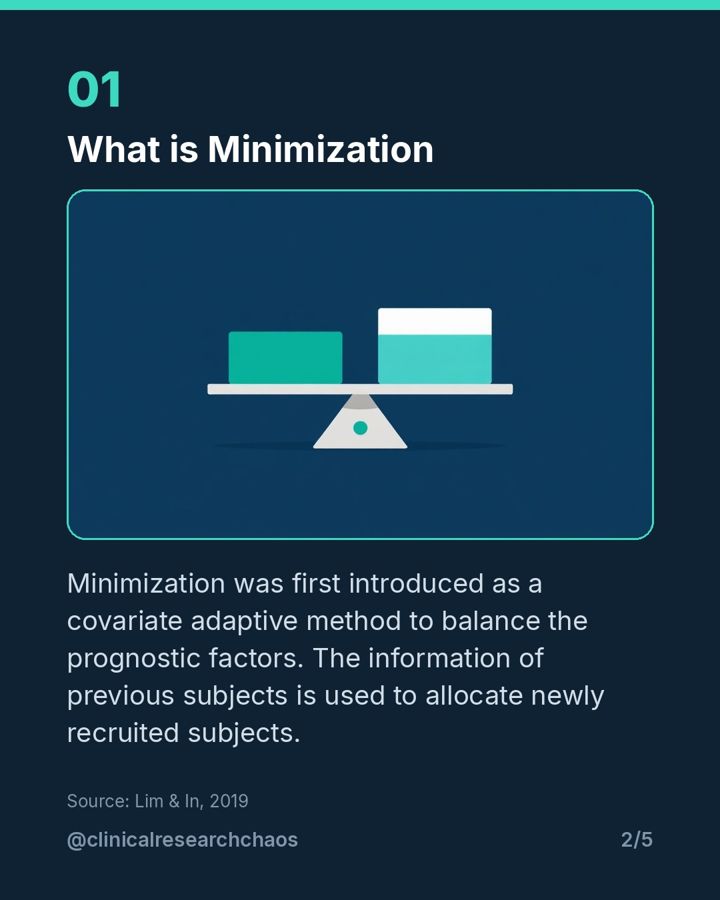
What is Minimization

Minimization was first introduced as a covariate adaptive method to balance the prognostic factors. The information of previous subjects is used to allocate newly recruited subjects.

How Allocation Works

First, the total number of imbalances is calculated after virtually allocating a newly recruited subject to all groups. The subject will be allocated to the group with lowest total number of imbalances.

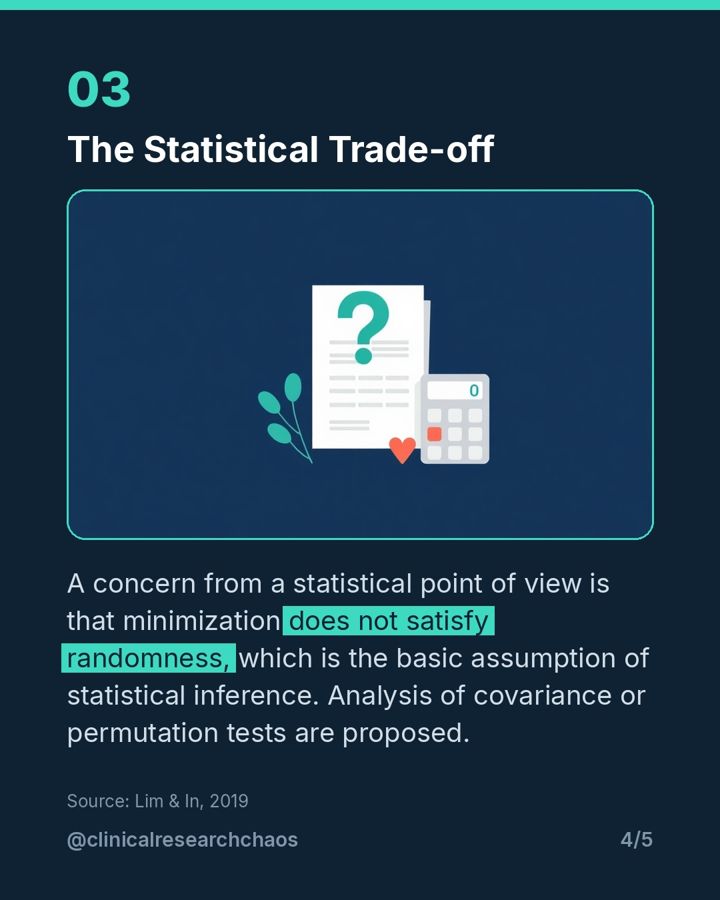
The Statistical Trade-off

A concern from a statistical point of view is that minimization does not satisfy randomness, which is the basic assumption of statistical inference. Analysis of covariance or permutation tests are proposed.

References

Lim, C.-Y., & In, J. (2019). Randomization in clinical studies. Korean Journal of Anesthesiology, 72(3), 221-232.
Did Blinding Actually Work in Your Trial? – slide 1 of 6Did Blinding Actually Work in Your Trial? – slide 2 of 6Did Blinding Actually Work in Your Trial? – slide 3 of 6Did Blinding Actually Work in Your Trial? – slide 4 of 6Did Blinding Actually Work in Your Trial? – slide 5 of 6Did Blinding Actually Work in Your Trial? – slide 6 of 6
20 Oct 2026

Did Blinding Actually Work in Your Trial?

Blinding cannot simply be assumed; side effects and perceived efficacy can easily unmask trials if not measured.

Key points and references

An assumption rarely tested

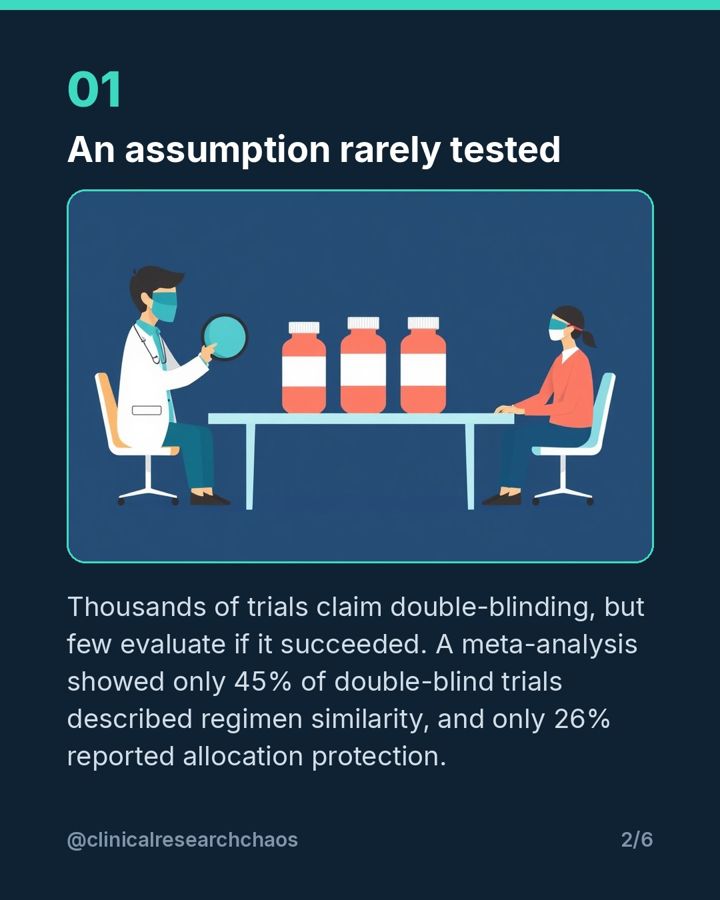
Thousands of trials claim double-blinding, but few evaluate if it succeeded. A meta-analysis showed only 45% of double-blind trials described regimen similarity, and only 26% reported allocation protection.

How the blind breaks down

Technical masking of appearance, smell, and taste is not enough. Side effects, perceived therapeutic efficacy, or informal conversations often provide clues that unmask participants and clinicians beyond chance.

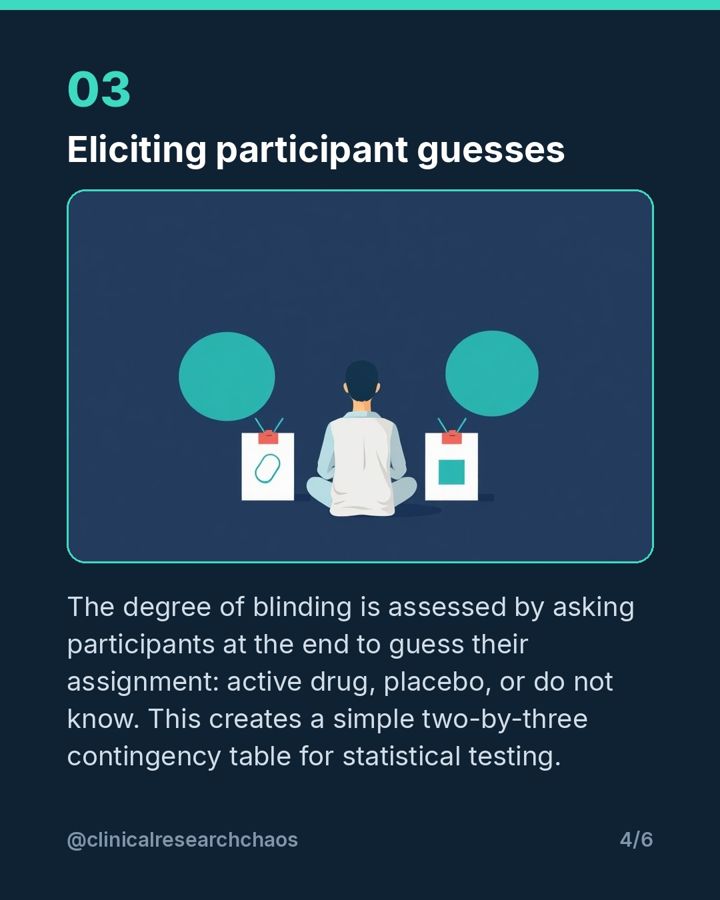
Eliciting participant guesses

The degree of blinding is assessed by asking participants at the end to guess their assignment: active drug, placebo, or do not know. This creates a simple two-by-three contingency table for statistical testing.

Why unblinding threatens validity

Unblinding can introduce ascertainment bias, alter participant compliance, and even affect ancillary care and attention, potentially compromising trial validity even when measuring objective outcomes.

Why Simple Randomization Fails in Small Trials – slide 1 of 6Why Simple Randomization Fails in Small Trials – slide 2 of 6Why Simple Randomization Fails in Small Trials – slide 3 of 6Why Simple Randomization Fails in Small Trials – slide 4 of 6Why Simple Randomization Fails in Small Trials – slide 5 of 6Why Simple Randomization Fails in Small Trials – slide 6 of 6
20 Oct 2026

Why Simple Randomization Fails in Small Trials

In small trials, simple randomization risks severe group size imbalances that degrade statistical power.

Key points and references

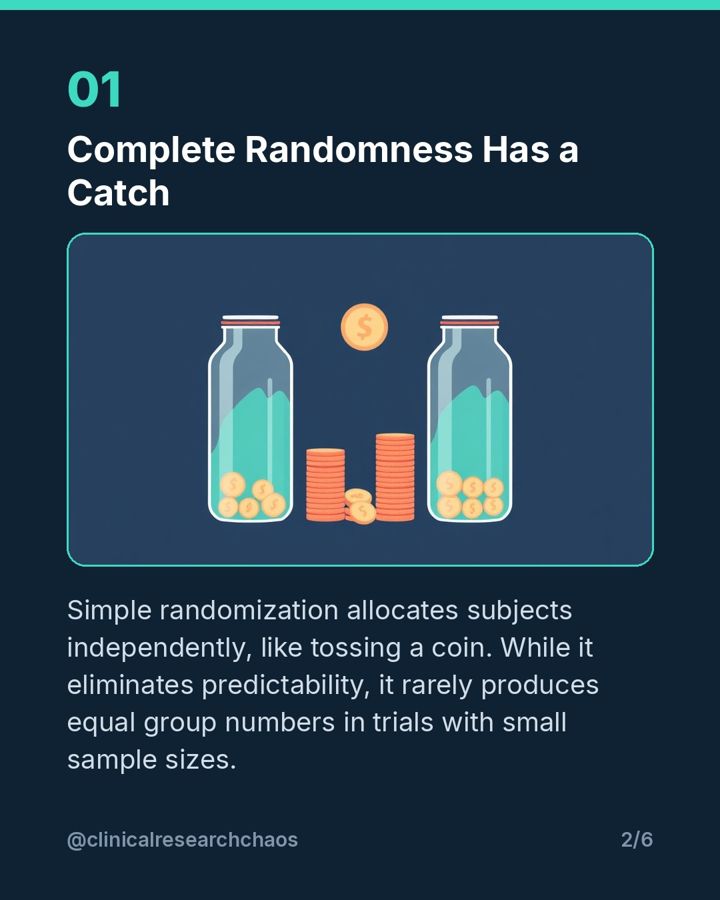
Complete Randomness Has a Catch

Simple randomization allocates subjects independently, like tossing a coin. While it eliminates predictability, it rarely produces equal group numbers in trials with small sample sizes.

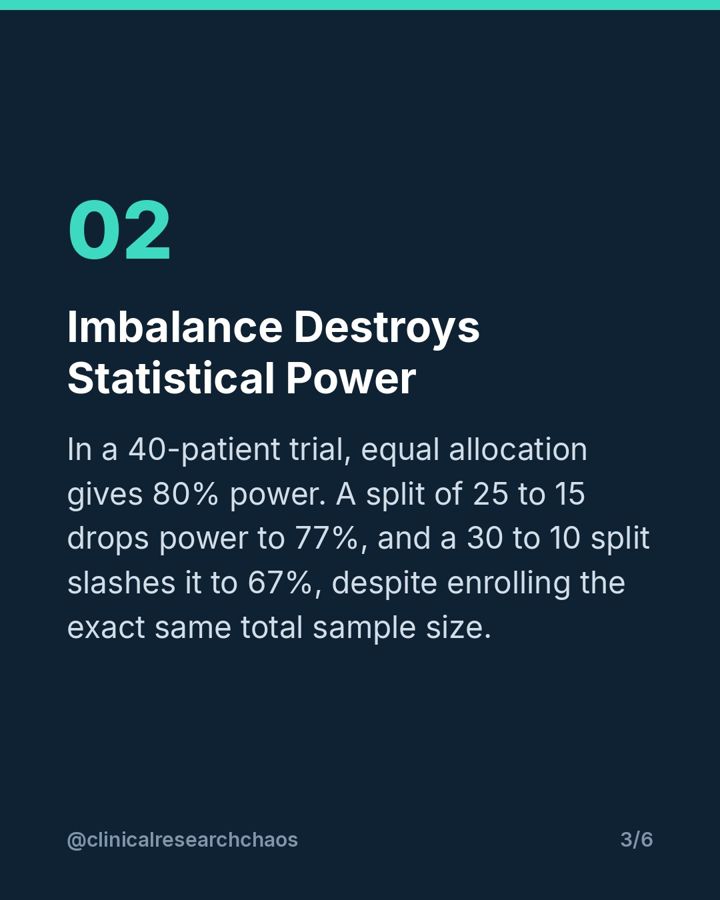
Imbalance Destroys Statistical Power

In a 40-patient trial, equal allocation gives 80% power. A split of 25 to 15 drops power to 77%, and a 30 to 10 split slashes it to 67%, despite enrolling the exact same total sample size.

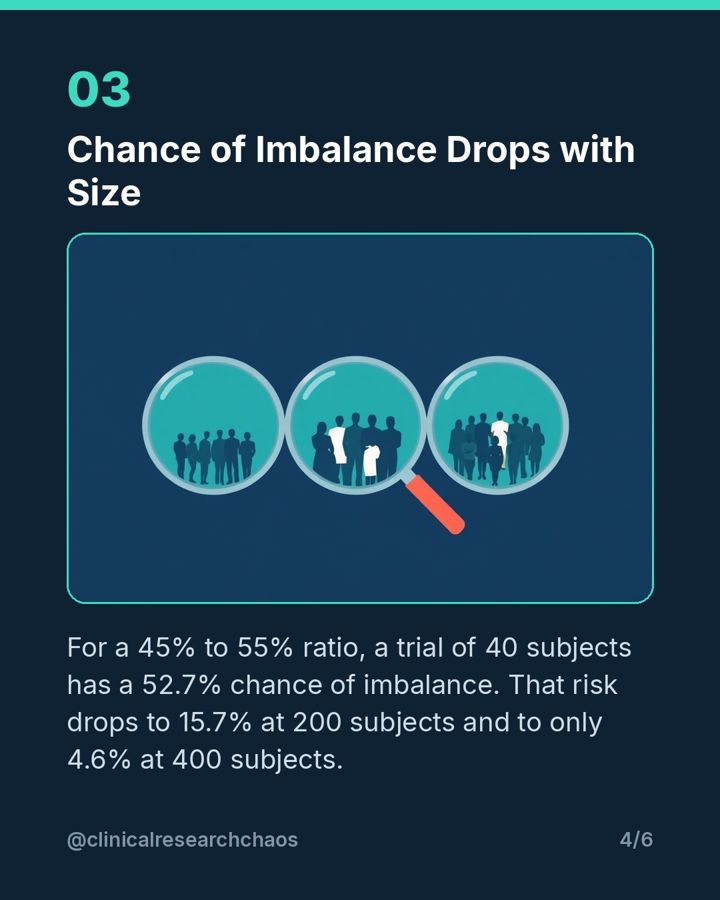
Chance of Imbalance Drops with Size

For a 45% to 55% ratio, a trial of 40 subjects has a 52.7% chance of imbalance. That risk drops to 15.7% at 200 subjects and to only 4.6% at 400 subjects.

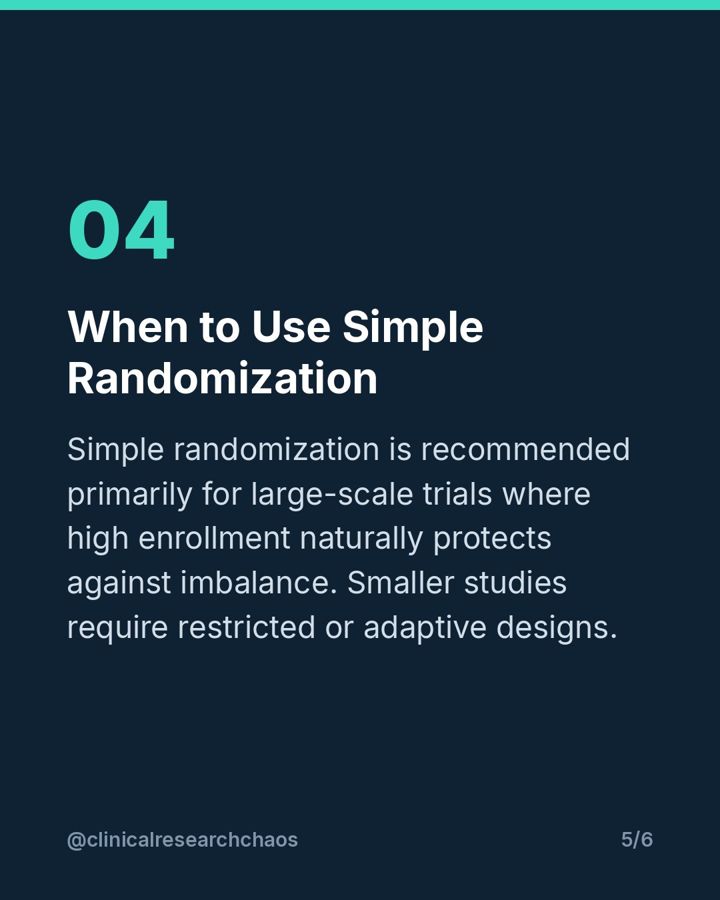
When to Use Simple Randomization

Simple randomization is recommended primarily for large-scale trials where high enrollment naturally protects against imbalance. Smaller studies require restricted or adaptive designs.

The Major Blind Spot of James' Blinding Index – slide 1 of 6The Major Blind Spot of James' Blinding Index – slide 2 of 6The Major Blind Spot of James' Blinding Index – slide 3 of 6The Major Blind Spot of James' Blinding Index – slide 4 of 6The Major Blind Spot of James' Blinding Index – slide 5 of 6The Major Blind Spot of James' Blinding Index – slide 6 of 6
20 Oct 2026

The Major Blind Spot of James' Blinding Index

A single overall blinding index can conceal unblinding when high proportions of 'don't know' or opposing arm biases cancel out.

Key points and references

The traditional approach

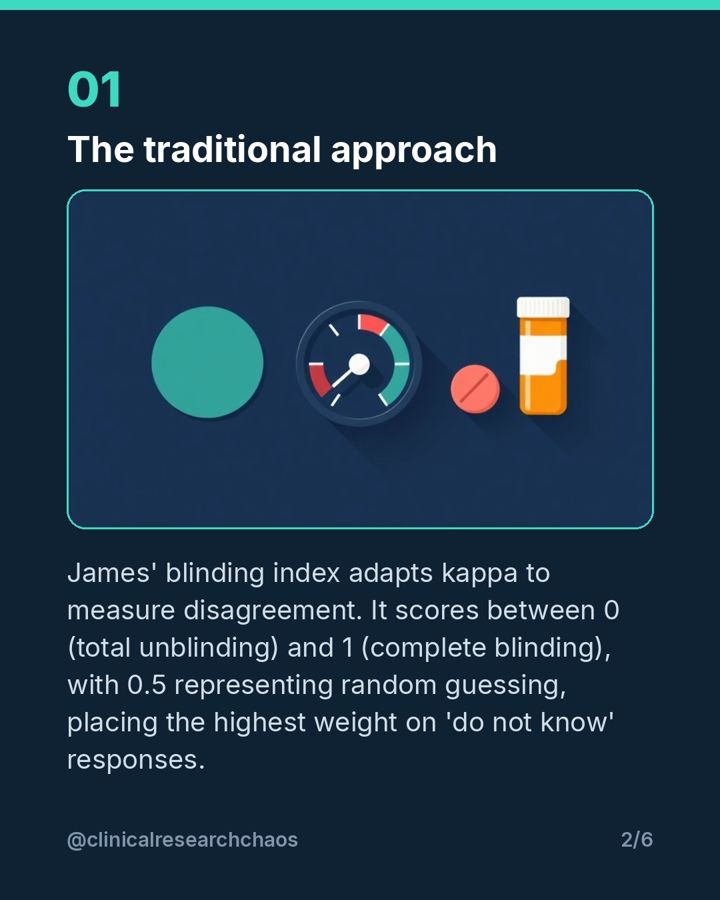
James' blinding index adapts kappa to measure disagreement. It scores between 0 (total unblinding) and 1 (complete blinding), with 0.5 representing random guessing, placing the highest weight on 'do not know' responses.

Dominated by 'Don't Know'

When 30% to 70% of participants answer 'do not know', James' index almost never rejects the null hypothesis of successful blinding, even when all participants who ventured a guess were completely unblinded.

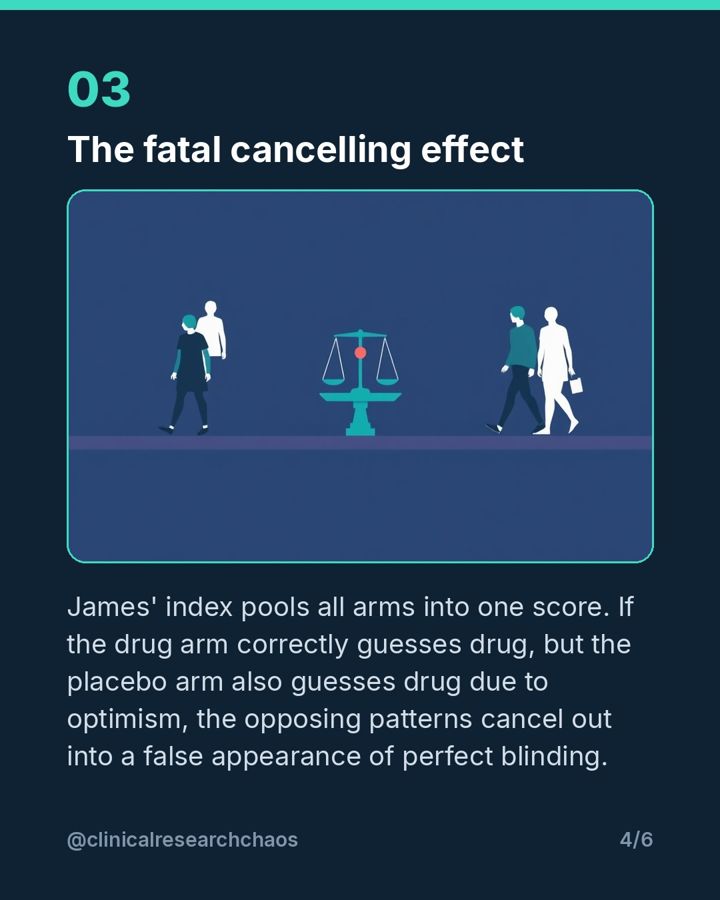
The fatal cancelling effect

James' index pools all arms into one score. If the drug arm correctly guesses drug, but the placebo arm also guesses drug due to optimism, the opposing patterns cancel out into a false appearance of perfect blinding.

The need for arm-specific analysis

Because blinding mechanisms and expectations differ between active and control arms, evaluating blinding must be done separately for each arm rather than collapsing everything into a single overall metric.

Bang's Blinding Index: A Better Way to Measure – slide 1 of 6Bang's Blinding Index: A Better Way to Measure – slide 2 of 6Bang's Blinding Index: A Better Way to Measure – slide 3 of 6Bang's Blinding Index: A Better Way to Measure – slide 4 of 6Bang's Blinding Index: A Better Way to Measure – slide 5 of 6Bang's Blinding Index: A Better Way to Measure – slide 6 of 6
20 Oct 2026

Bang's Blinding Index: A Better Way to Measure

Bang's index evaluates arms separately, giving a clear proportion of participants unblinded beyond chance between -1 and +1.

Key points and references

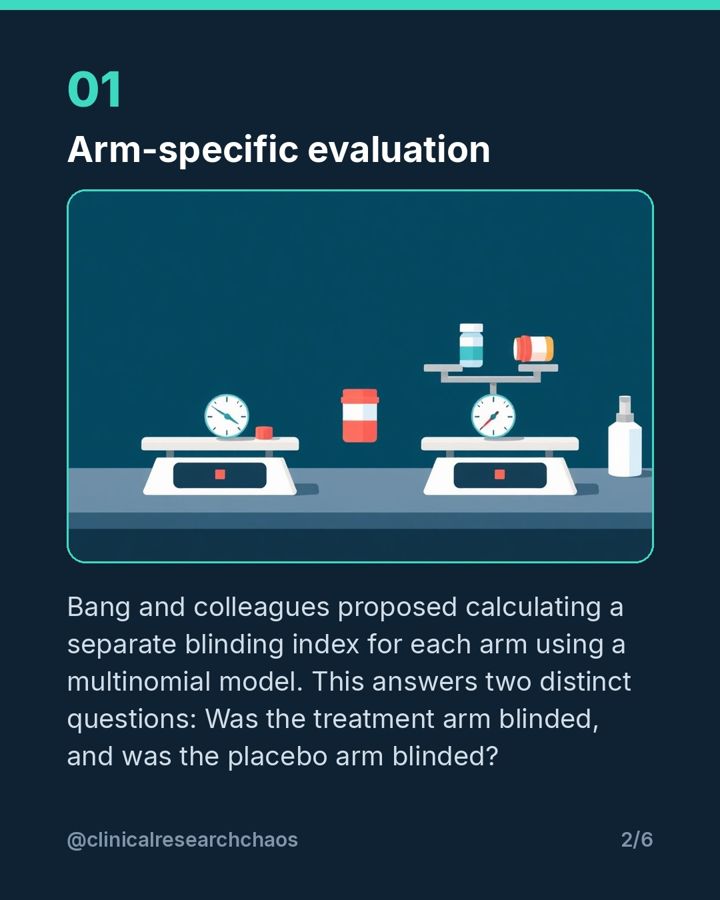
Arm-specific evaluation

Bang and colleagues proposed calculating a separate blinding index for each arm using a multinomial model. This answers two distinct questions: Was the treatment arm blinded, and was the placebo arm blinded?

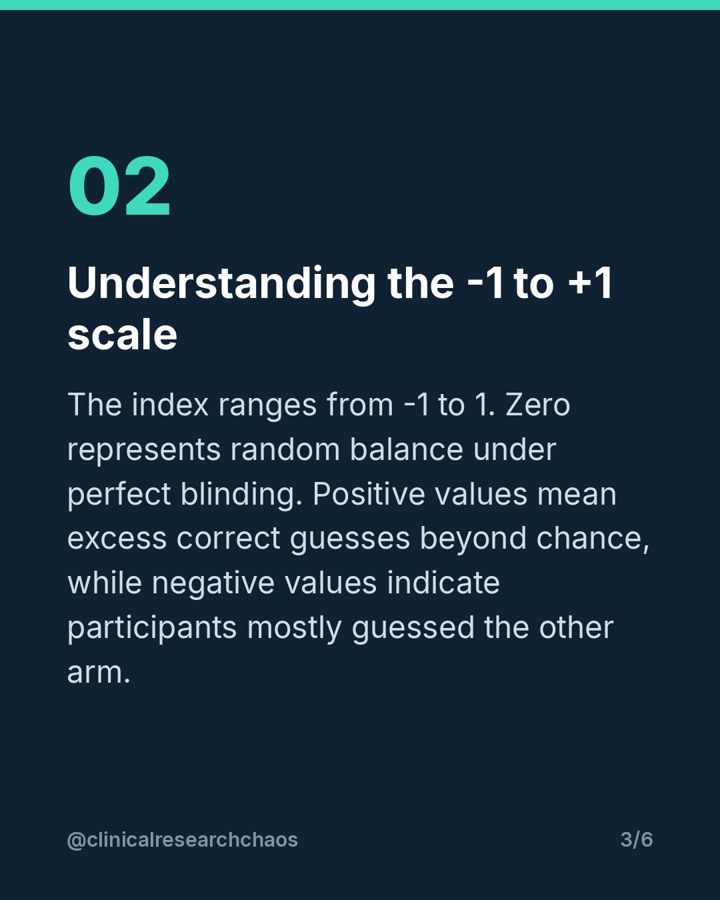
Understanding the -1 to +1 scale

The index ranges from -1 to 1. Zero represents random balance under perfect blinding. Positive values mean excess correct guesses beyond chance, while negative values indicate participants mostly guessed the other arm.

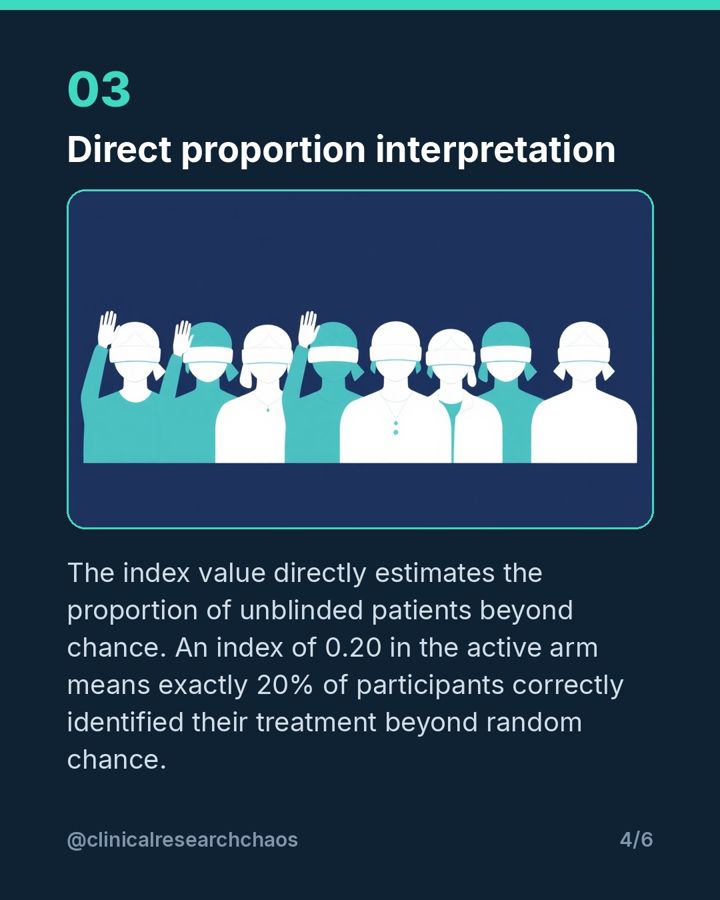
Direct proportion interpretation

The index value directly estimates the proportion of unblinded patients beyond chance. An index of 0.20 in the active arm means exactly 20% of participants correctly identified their treatment beyond random chance.

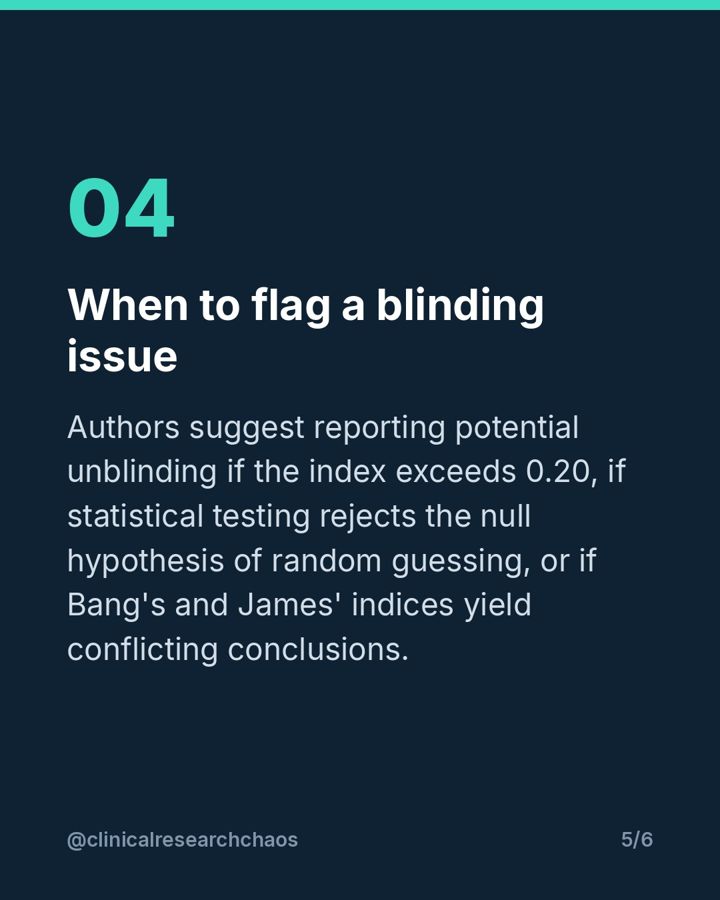
When to flag a blinding issue

Authors suggest reporting potential unblinding if the index exceeds 0.20, if statistical testing rejects the null hypothesis of random guessing, or if Bang's and James' indices yield conflicting conclusions.

Research ethics

The Ethical Dilemma of Randomization in Research – slide 1 of 5The Ethical Dilemma of Randomization in Research – slide 2 of 5The Ethical Dilemma of Randomization in Research – slide 3 of 5The Ethical Dilemma of Randomization in Research – slide 4 of 5The Ethical Dilemma of Randomization in Research – slide 5 of 5
24 Oct 2026

The Ethical Dilemma of Randomization in Research

Clinical trials force individual participants to accept risks and uncertainties so that future patients may benefit.

Key points and references

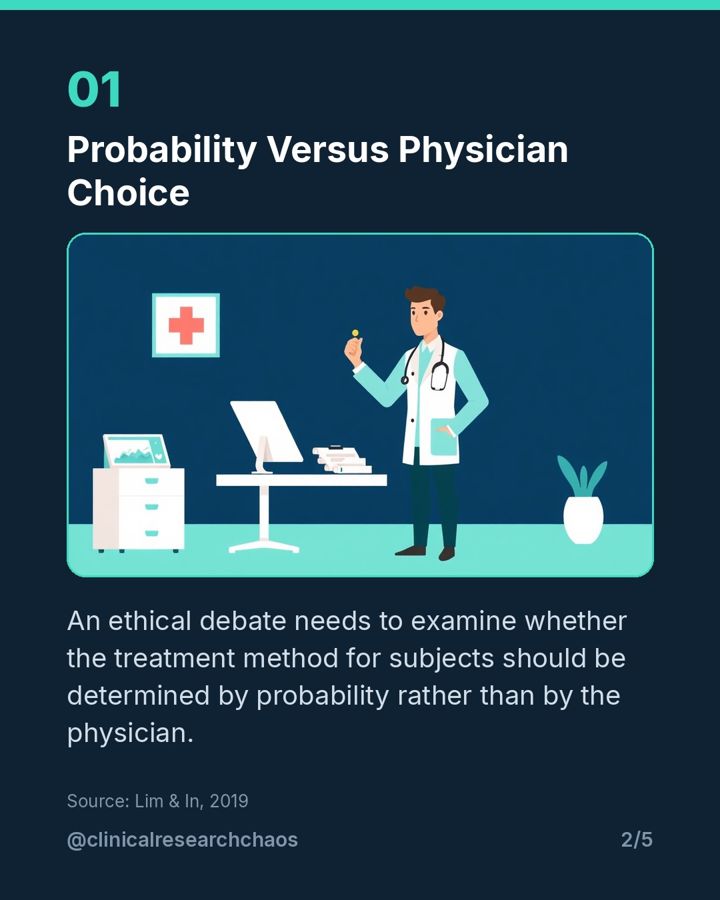
Probability Versus Physician Choice

An ethical debate needs to examine whether the treatment method for subjects should be determined by probability rather than by the physician.

The Burden on Participants

Furthermore, the subjects may be given a placebo, and not treatment. Some subjects have to undergo further treatment, representing the cost that society has to pay for the benefit of future subjects.

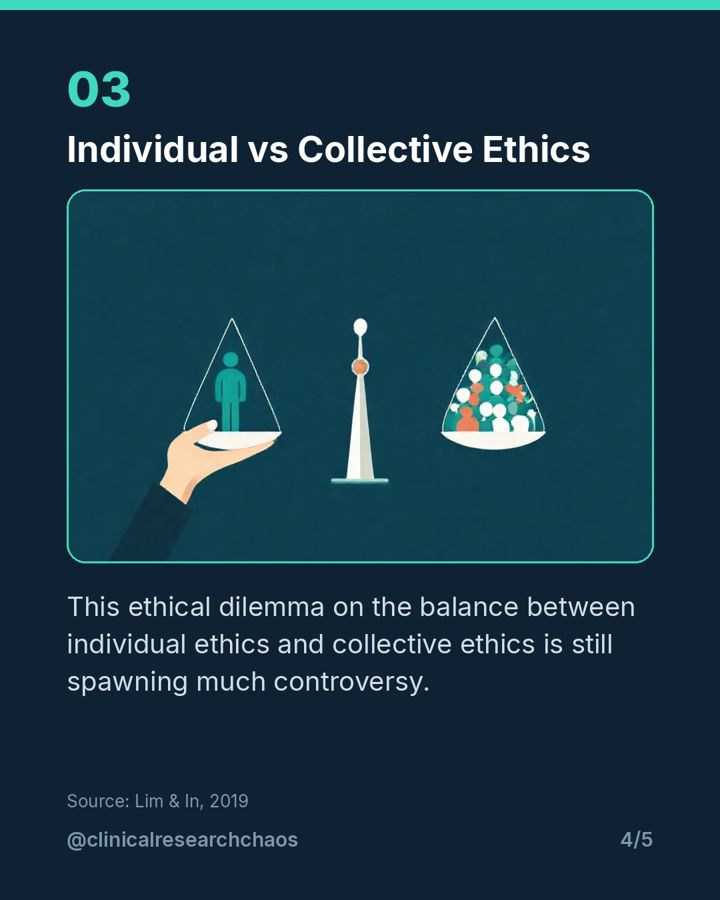
Individual vs Collective Ethics

This ethical dilemma on the balance between individual ethics and collective ethics is still spawning much controversy.

References

Lim, C.-Y., & In, J. (2019). Randomization in clinical studies. Korean Journal of Anesthesiology, 72(3), 221-232.
Study design

Why PICO Fails Non-Intervention Questions – slide 1 of 6Why PICO Fails Non-Intervention Questions – slide 2 of 6Why PICO Fails Non-Intervention Questions – slide 3 of 6Why PICO Fails Non-Intervention Questions – slide 4 of 6Why PICO Fails Non-Intervention Questions – slide 5 of 6Why PICO Fails Non-Intervention Questions – slide 6 of 6
24 Oct 2026

Why PICO Fails Non-Intervention Questions

PICO is tailored for intervention comparisons and struggles with qualitative, diagnostic, or descriptive inquiries.
Key points and references

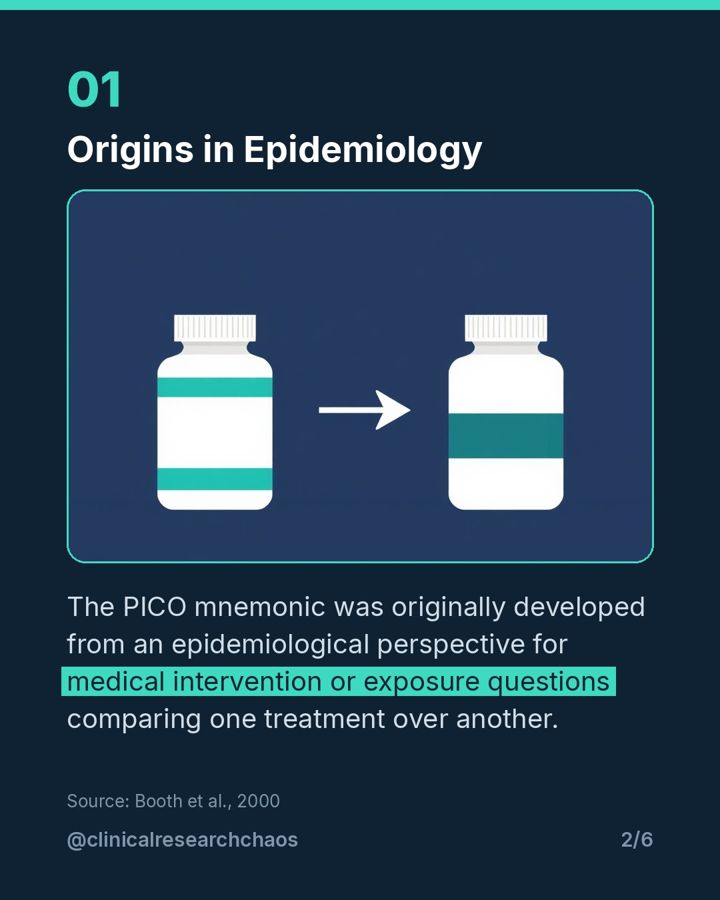
Origins in Epidemiology

The PICO mnemonic was originally developed from an epidemiological perspective for medical intervention or exposure questions comparing one treatment over another.

Built for Which Questions

PICO is most suitable for which type questions that compare one treatment, therapy, or intervention over another, but lacks usefulness for diagnosis and prognosis.

Beyond the Medical Model

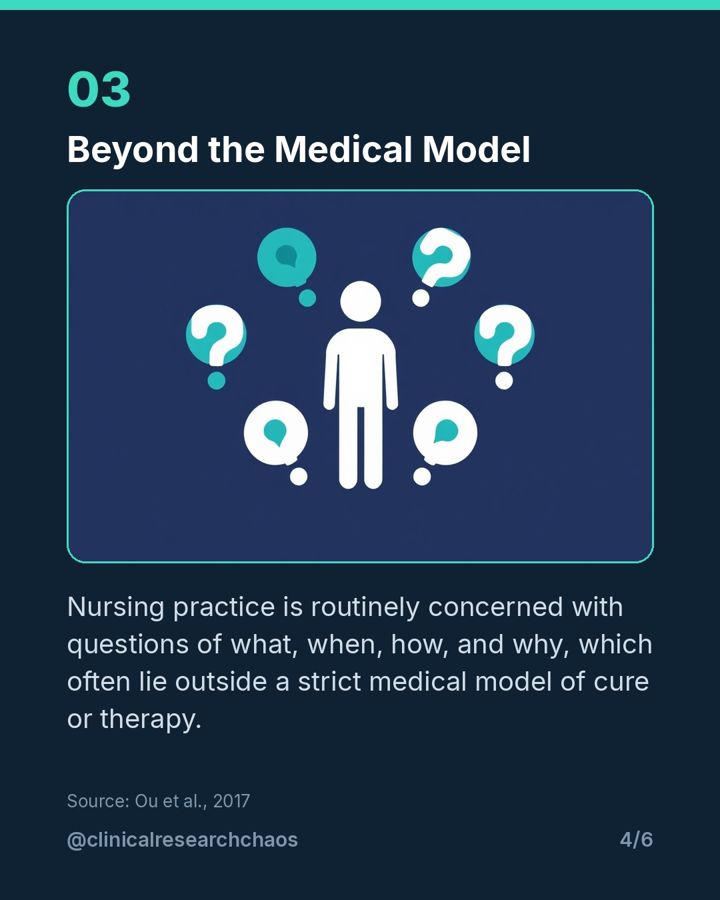
Nursing practice is routinely concerned with questions of what, when, how, and why, which often lie outside a strict medical model of cure or therapy.

The Qualitative Blind Spot

Despite adaptations like removing the comparator, PICO remains ill-suited for identifying qualitative research articles focused on process and meaning.

References

Booth, A., O’Rourke, A. J., & Ford, N. J. (2000). Structuring the pre-search reference interview: a useful technique for handling clinical questions.

Huang, X., Lin, J., & Demner-Fushman, D. (2006). Evaluation of PICO as a knowledge representation for clinical questions.

Ou, C. H. K., Hall, W. A., & Thorne, S. E. (2017). Can nursing epistemology embrace <i>p</i>‐values?. Nursing Philosophy, 18(4). https://doi.org/10.1111/nup.12173

Cooke, A., Smith, D., & Booth, A. (2012). Beyond PICO. Qualitative Health Research, 22(10), 1435–1443. https://doi.org/10.1177/1049732312452938

Research methods

Does PICO Actually Improve Literature Search Quality? – slide 1 of 6Does PICO Actually Improve Literature Search Quality? – slide 2 of 6Does PICO Actually Improve Literature Search Quality? – slide 3 of 6Does PICO Actually Improve Literature Search Quality? – slide 4 of 6Does PICO Actually Improve Literature Search Quality? – slide 5 of 6Does PICO Actually Improve Literature Search Quality? – slide 6 of 6
21 Oct 2026

Does PICO Actually Improve Literature Search Quality?

Evidence supporting the overall effectiveness of PICO as a literature search tool is lacking.

Key points and references

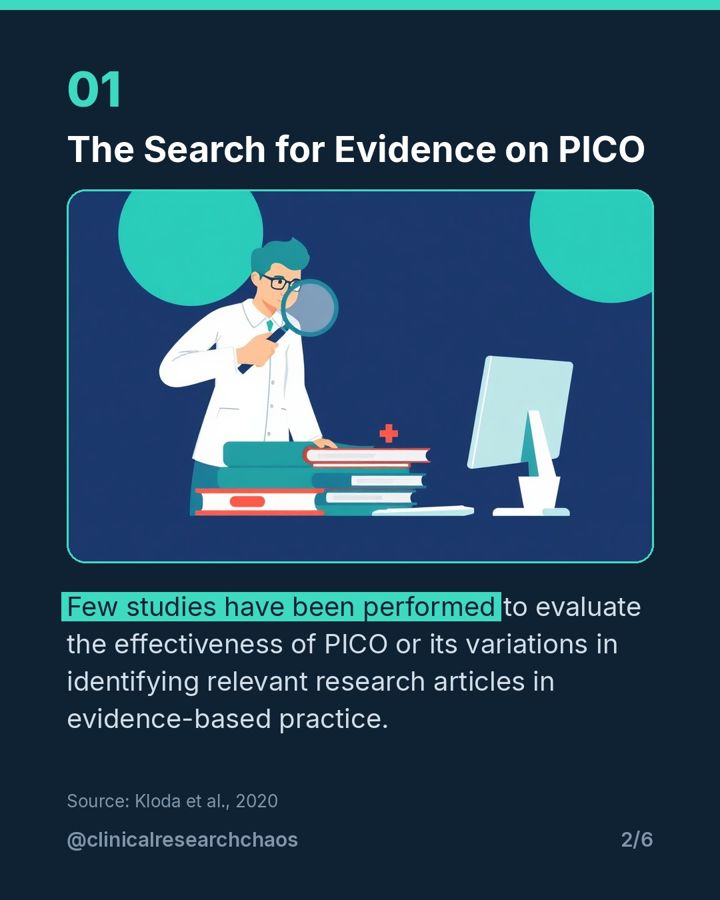
The Search for Evidence on PICO

Few studies have been performed to evaluate the effectiveness of PICO or its variations in identifying relevant research articles in evidence-based practice.

Pilot Trials and Precision

A pilot randomized trial found that searches using PICO resulted in higher percentages of relevant citations, but the findings did not reach statistical significance.

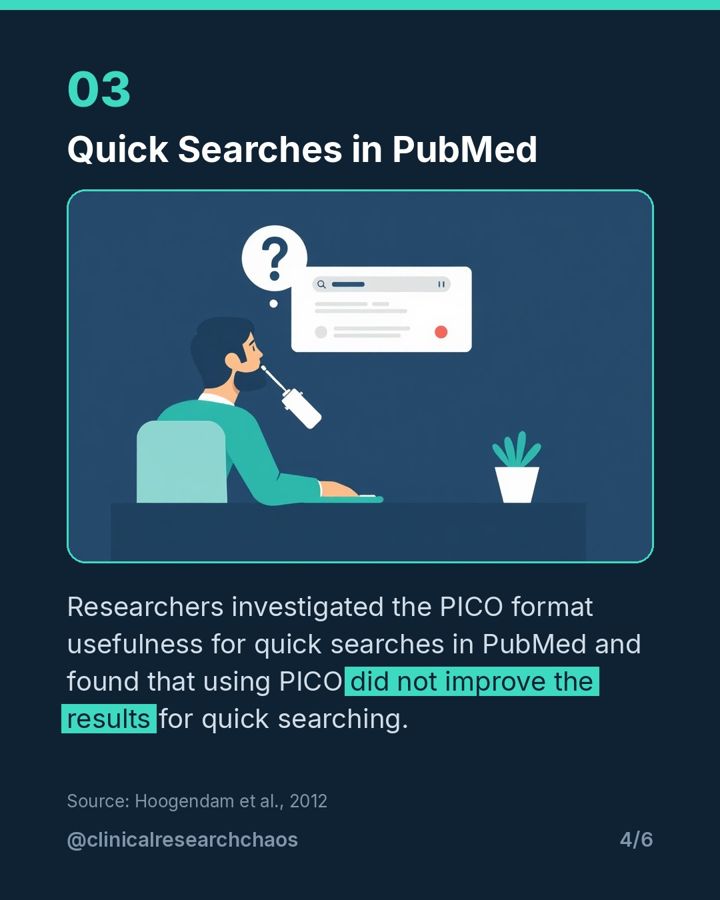
Quick Searches in PubMed

Researchers investigated the PICO format usefulness for quick searches in PubMed and found that using PICO did not improve the results for quick searching.

What Systematic Reviews Show

A systematic review aimed to determine if PICO improved search quality, but could only include three articles and concluded that evidence was lacking.

References

Kloda, L. A., Boruff, J. T., & Soares Cavalcante, A. (2020). A comparison of patient, intervention, comparison, outcome (PICO) to a new, alternative clinical question framework for search skills, search results, and self-efficacy: a randomized controlled trial. Journal of the Medical Library Association, 108(2). https://doi.org/10.5195/jmla.2020.739

Schardt, C., Adams, M. B., Owens, T., Keitz, S., & Fontelo, P. (2007). Utilization of the PICO framework to improve searching PubMed for clinical questions. BMC Medical Informatics and Decision Making, 7(1). https://doi.org/10.1186/1472-6947-7-16

Hoogendam, A., de Vries Robbé, P. F., & Overbeke, A. J. P. (2012). Comparing patient characteristics, type of intervention, control, and outcome (PICO) queries with unguided searching: a randomized controlled crossover trial. Journal of the Medical Library Association : JMLA, 100(2), 121–126. https://doi.org/10.3163/1536-5050.100.2.010

Eriksen, M. B., & Frandsen, T. F. (2018). The impact of patient, intervention, comparison, outcome (PICO) as a search strategy tool on literature search quality: a systematic review. Journal of the Medical Library Association, 106(4). https://doi.org/10.5195/jmla.2018.345